Tuesday, November 27, 2012

Zale Corporation (ZLC) Straddle

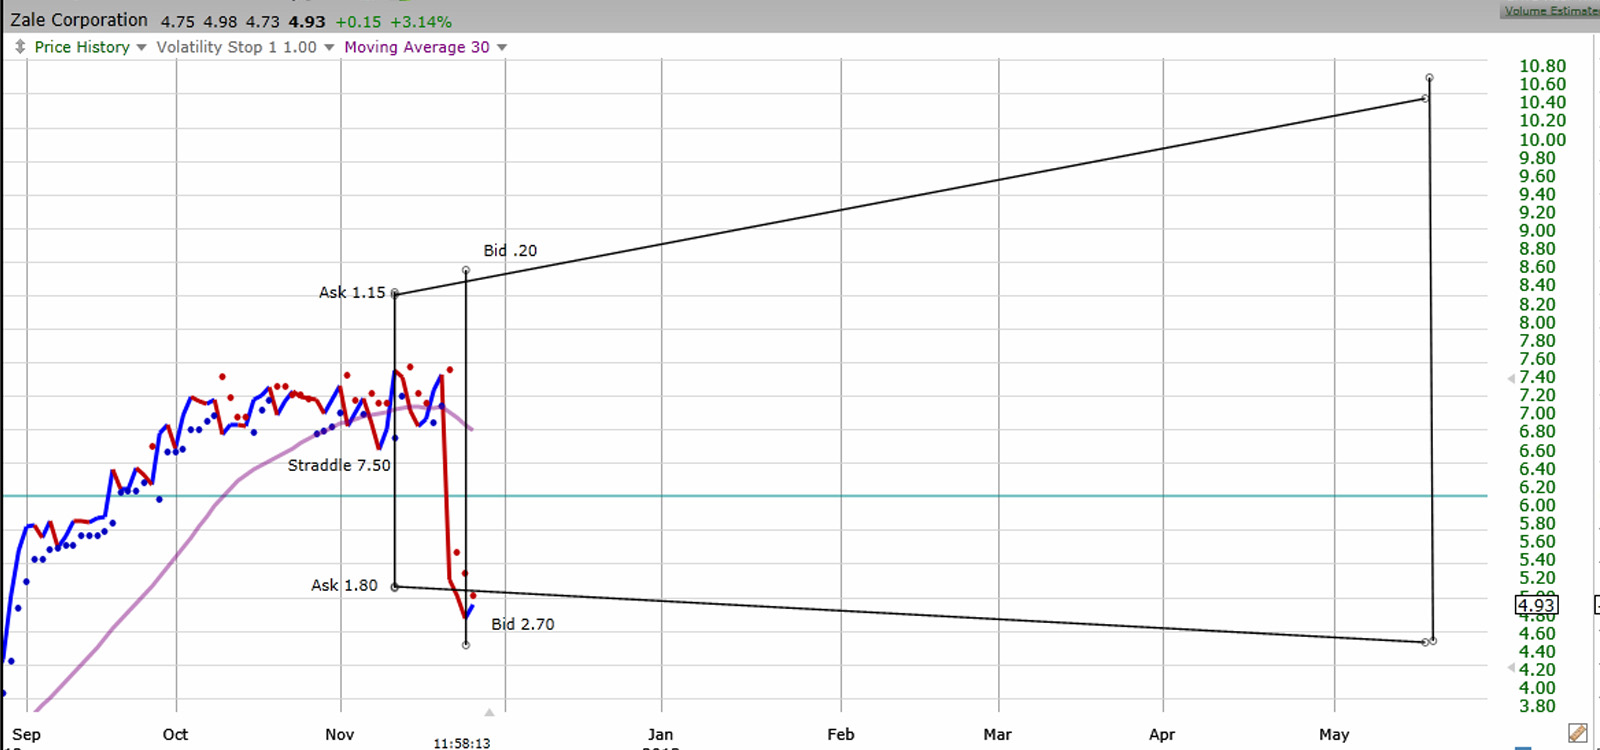
Zale Straddle 7.50 May 13 2013


Zale Corporation (ZLC) 4.83          Straddle May 13 2013 7.50

11/13/12 Straddle Strike 7.50      Call         Ask         1.15      
                                                    Put         Ask         1.80
                Net Debit:                                                -2.95

11/27/12 Straddle Strike 7.50      Call         Bid          .20
                                                    Put         Bid          2.70
                Net Credit:                                                2.90
                                                                     Short     -.5      
    
Black Scholes hypothetical break even upon date, 11/13/12, straddle buy is slightly short $-5

Sell back               Call         Bid          .20
Exercise                Put          Bid          2.70 @ Strike 7.50 Trading Price 4.83
7.5 – 4.83 = 2.67 + .20 = 2.87
                Net Credit:                                                 2.87
                                                                      Short     -.8

Exercise is short $-8 according to hypothetical Black Scholes upon buy date 11/13/12

Why? Volatility increase does not outweigh Theta decrease, yet.

Upon:  11/27/2012 Net Delta: -49.737 Gamma: 27.679 Theta: -0.404 Vega: 2.148

90 day HV:           91.99%                  one week ago   67.54%                  Increase               24.55%
90 day IV:            63.58%                  one week ago   62.26%                  Increase               1.32%

Straddle price should rise.

This is a good substitute for buying the stock. Since the price is so low. A $295 dollar hedge to own 100 shares at 7.50, if the stock was bought at that price would be $750. Then the stock falls 267 dollars to $483. Owning the shares would have been roughly a 30% loss, where owning the straddle is only a $5 loss.

Logical Action:

ZLC Strangle Strike: 5.00 and 7.50


11/29/12 Straddle Strike 7.50       Call         Bid          .25
                                                     Put         Bid          2.70
                Net Credit:                                                  2.90
                                                                  Even          0

Sell         Call         Bid          .25
Buy        Call         Ask         .90          Strike 5.00
Hold       Put         Bid          2.70
                Net Debit:                                                           -.335

Strangle break evens have narrowed.

12/20/12 ZLC Strangle Strike 5.00 and 7.50


12/20/12 Strangle Strike 7.50 and 5.00
                                                7.50        Call         Bid          .40
                                                5.00        Put         Bid          3.20
                Net Credit:                                                          3.60
                Profit:                                                                   $25


Sunday, November 25, 2012

Trend Change DJ-30

"Fiscal Cliff" Trend Change

In physics Fibonacci scale can be used in proportion with gravity and electromagnetism. Ultimately the event horizon of gravity is touched by electromagnetism as it speeds. At that point there is a sharp acceleration in direction. In physics it is in the "negative" to be pulled into the singularity in regards to a black hole. In market Fibonacci there is usually is a bounce back to grow more. This pattern has been hyper inflated as the Federal bank dumps money into the market; making the scale exaggerated.

This is an overall estimate of date and price. The vertical green line is the date of the "Fiscal Cliff." When July moves around there will be, according to this, an overall terminal point for a trend change.

The upward trend was drawn from the last crossover. Twice the movement has tested the trend line and bounced back off speculative profit supply. Since the beginning of 2009 every retracement has been close or on par with Fibonacci measurements. The news date, "Fiscal Cliff," crosses over around the beginning of 2013. It seemed logical to bisect the date perpendicular with the moving trend. the angle degrees of the formed triangle are roughly in sync with 30-60-90 triangle, but seem closer to Fibonacci. Several things can occur between "Fiscal Cliff" and speculative end of trend. There possibly will be a sharp directional change between the green line and pink line reaching down to 61.8% or close. The possibility of the change reaching  32.8% between green and pink., then correcting outside of the triangle higher than the upward trend. Then crashing down to 61.8% or more. How do I get that possibility? Look at each micro retracement, they all have a small sharp drop then correction then larger drop. This is because traders think prices are good enough to buy, bounce off support, then prices are high enough to sell bounce off resistance with more people selling. Then there is the possibility of hyper inflation, the market sky rockets to and inflation moves with it maybe even surpassing it. Then there is the possibility of inverse Fibonacci (ln x). This is extremely dangerous because everyone will be uncertain and an inverse cup will begin to form. Then we are talking about a crash in the market too or below 2009. The tightening market shows evidence of a rounded bottom. As long as the Federal Bank continues to manipulate our monetary value this chance becomes greater. Then there is just the return to pre-Carter stagflation just with higher commodity prices and a larger gap between poverty and wealthy politician and constituent. With the President's "Volcker Rule," the market is tanked on purpose. This would be an inverse extended cup, handle maybe. The only ones to profit from this would be the one's who are immune to its effect, politicians. This would be devastating to the rest of the population but insure no growing threat to political overthrow. "The president's third term."

All of these scenarios apply if the market moves before the "Fiscal Cliff." The market moves before news when people are unsure.


Saturday, November 24, 2012

Fiscal Cliff.....

First I will comment about the fiscal cliff. Basically the market is fueled by fear and greed. The fear is higher taxes and regulations. The greed is the market's narrowing rise as people try to get in and get out with quick profits before capital gains tax rises. Here is what I mean by market narrowing. Drawings 11/25/2012

"Fiscal Cliff" Upward Trend


To start...

This is more for me to take notes about movements in the market regarding different option positions. I will post pictures and analysis of different strategies so if you want to follow then do it.